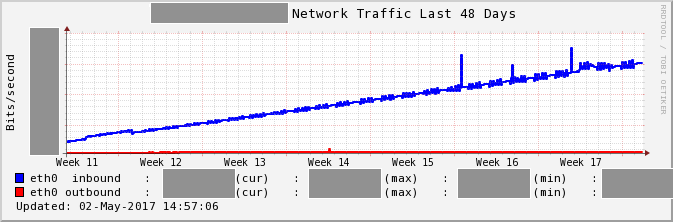
This graph represents network traffic of a server.
Concrete figures have been masked, however, it can be seen that network traffic volume is gradually increasing over several weeks.
This article provides that how to investigate network traffic breakdown using tshark.
What is tshark
tshark is a CUI equivalent of Wireshark.
If you are using RHEL-based distribution, You can use tshark by installing wireshark package.
This article was written with Tshark 1.8.10, installed by wireshark-1.8.10-17.el6.x86_64
tcpdump is one of the most famous tools as CUI-based packet capture tool.
It is a similar tool from the point of view that it can capture packets and display the contents; however, tshark is a more helpful tool that has many functions, such as to decode the packets into Human-Readable and to aggregates packets over a given time interval and calculates statistical information.
You can see how to use tshark by man command, or some nice articles were written already.
Investigation
-z is one of the best useful options implemented in tshark, it allows you to display statistical information.
In this post, I investigated network traffic by using the statistical information displayed by -z option.
At first, I see the ratio between TCP and UDP of this packets.
Notes: For the sake of convenience, I rewrote some of the commands, outputs, IP addresses, figures and others by hand.
$ tshark -a duration:60 -f 'dst host 172.17.XXX.XXX' -q -z io,stat,10,tcp,udp
Capturing on eth0
16 packets dropped
2666 packets captured

===================================================================
| IO Statistics                                                   |
|                                                                 |
| Interval size: 10 secs                                          |
| Col 1: Frames and bytes                                         |
|     2: tcp                                                      |
|     3: udp                                                      |
|-----------------------------------------------------------------|
|          |1                 |2                 |3               |
| Interval | Frames |  Bytes  | Frames |  Bytes  | Frames | Bytes |
|-----------------------------------------------------------------|
|  0 <> 10 |    164 |   41351 |    162 |   40863 |      2 |   488 |
| 10 <> 20 |   1177 | 6283124 |   1165 | 6280295 |     12 |  2829 |
| 20 <> 30 |    871 | 4516942 |    863 | 4514656 |      8 |  2286 |
| 30 <> 40 |    204 |   43122 |    200 |   42138 |      4 |   984 |
| 40 <> 50 |    137 |   21731 |    135 |   21462 |      2 |   269 |
| 50 <> 58 |    113 |   28049 |    110 |   27351 |      2 |   638 |
===================================================================
I will explain the command line options.
-a duration:60: Specify the condition of stopping tshark. duration:60 means stop 60 seconds later.-f 'dst host 172.17.XXX.XXX': Set the capture filter expression. To investigate inbound traffic, specify destination host is an own IP address.-q: Suppress output of each captured packets. It is necessary to show only statistical information.-z io,stat,10,tcp,udp: -z is an option for showing statistical information. io,stat,interval[,filter][,filter][,filter]… means that aggregates how many packets / bytes the communication matching filter was during the interval interval. tcp, udp represent TCP communication and UDP communication respectively as you can see.
I think the content of the output is not so difficult.
2 in the table indicates TCP communication, and 3 indicates UDP communication .
1 is the total amount of captured packets.
From this result, I found that most of the communication is TCP. So, in this TCP communication, what host is the destination and what kind of communication is it? I checked it with the following command.
$ tshark -n -a duration:60 -f 'dst host 172.17.XXX.XXX' -q -z conv,tcp
Capturing on eth0
47 packets dropped
1623 packets captured
================================================================================
TCP Conversations
Filter:<No Filter>
                                               |       <-      | |       ->      | |     Total     |   Rel. Start   |   Duration   |
                                               | Frames  Bytes | | Frames  Bytes | | Frames  Bytes |                |              |
172.17.X.XX:47688    <-> 52.XXX.XX.XX:80          713   5288887       0         0     713   5288887     8.323630499        10.5606
172.17.X.XX:47760    <-> 52.XXX.XX.XX:80          425   3349593       0         0     425   3349593    13.359284739         6.5439
172.17.X.XX:47814    <-> 50.XX.XXX.XX:443          12      7029       0         0      12      7029    11.545835487         0.7044
172.17.X.XX:44320    <-> 50.XX.XXX.XXX:443         12      7018       0         0      12      7018    11.061043611         0.7214
.. snip ..
172.17.X.XX:38302    <-> 210.XXX.XX.XXX:443         4       279       0         0       4       279     2.884381083         0.0025
172.17.X.XX:39084    <-> 54.XXX.XXX.XXX:443         2       167       0         0       2       167    17.913879040         0.0001
210.XXX.XX.XXX:59861 <-> 172.17.X.XX:22             0         0       2       132       2       132     2.435391340        10.0354
210.XXX.XX.XXX:14136 <-> 172.17.X.XX:22             0         0       1       106       1       106    19.941849383         0.0000
================================================================================
I explain the options of the newly used command this time.
-n: Disable name resolution of hostname, port and so on.-z conv,tcp:For each pair of host and port, output the number of packets / Byte of communication.
I found that the response of the request for TCP port 80 of a host occupies most of the communication. Statistically see the contents of this http communication with the following command.
$ tshark -a duration:60 -q -z http_req,tree
Capturing on eth0
304 packets dropped
1795 packets captured

===================================================================
HTTP/Requests                                                  value             rate          percent
-------------------------------------------------------------------
HTTP Requests by HTTP Host                                         58       0.006287
  169.254.169.254                                                   38       0.004119          65.52%
   /latest/meta-data/iam/security-credentials/                       19       0.002059          50.00%
   /latest/meta-data/iam/security-credentials/XXX                    19       0.002059          50.00%
  XXX.s3.amazonaws.com                                              18       0.001951          31.03%
   /?prefix=XXXX                                                      1       0.000108           5.56%
   /?marker=XXXX&prefix=XXX/                                          1       0.000108           5.56%
   .. snip ..
   /?marker=XXXX&prefix=XXX/                                          1       0.000108           5.56%
   /XXX                                                               1       0.000108           5.56%
  .. snip ..
===================================================================
I explain the options of the newly used command this time.
-z http_req,tree: Calculate the HTTP requests by server. Displayed values are the server name and the URI path.
I found out that it is communication with Amazon S3.
If we came up until here, after that, it would be easy to clarify which process is communicating.
If making it difficult yet, you can also use ss or netstat and so on for clarifying the process.
In this case, we are doing periodic s3 sync to a certain S3 bucket. And the number of objects in this S3 bucket is gradually increasing. I found that accordance with the increase of the size of the file list, the traffic volume was also increasing.
Conclusion
Previously,I conducted such a survey like this way.
- Create a pcap file with tcpdump
- Transfer to GUI environment and check with Wireshark
But now, using tstark makes it easier to carry out.
In fact, I think that there are cases in which it is impossible to identify the cause cleanly like this time, and it is not possible to go ahead if we do a more muddy survey,
There are many other types of options for -z, so I think that it is better to choose a more convenient one to suit the content you want to investigate.
Share this post
Twitter
Google+
Facebook
Reddit
LinkedIn
StumbleUpon
Email